Greenhouse gas report 2022-2023
View our greenhouse gas report 2022-23
Greenhouse gas report 2021-2022
Executive summary
During 2022/23 Cherwell District Council decreased its carbon emissions by 3.1% (132 tonnes CO2e), from 4,209 tonnes CO2e in 2021/22 to 4,077 tonnes CO2e in 2022/23. This represents a 40% reduction against our baseline of 2008/09 (Figure 1). This includes offsetting from solar exports.
This represents a 52.7 per cent reduction against our baseline of 2008/09.
Context
We provide services to residents, businesses and communities across the whole county. The following are the key service services are provided by the Council (but not an exhaustive list):
- leisure services
- housing
- planning
- landscape and ground maintenance
- public convenience
- waste collection.
We provide these services either directly or commission them from other organisations. Most of these services are statutory – things we are obliged by law to do.
Reporting period
This report covers GHG emissions from April 2020 to March 2021 with comparisons to previous years.
Introduction, boundary and conversion factors
Each year we publish details of our greenhouse gas (GHG) emissions in accordance with the guidance published by the Department of Business, Energy and Industrial Strategy (BEIS).
We are committed to improving our GHG reporting in line with the latest BEIS guidance. We will be auditing our data in 2020/21.
Scope of our reported GHG emissions boundary
We report on emissions from our corporate buildings, public conveniences, waste collection fleet and business mileage, our outsourced leisure centres and landscape service. These have historically been included in our carbon footprint.
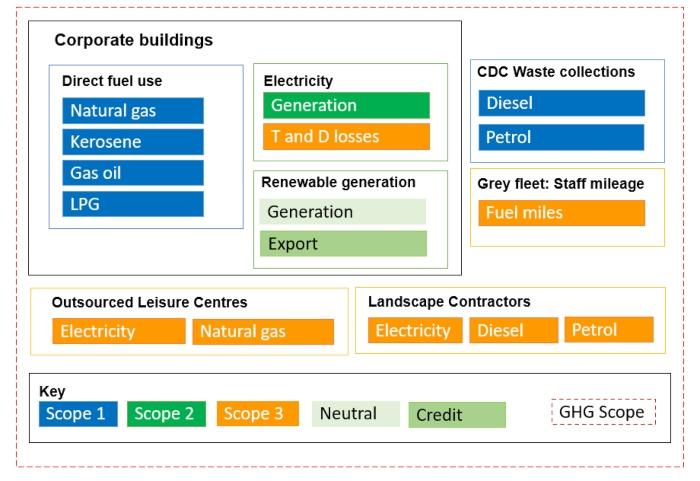
| Area | Scope | Includes |
|---|---|---|
| Corporate buildings | 1 | Natural gas, kerosene, gas oil and LPG |
| Waste collections | 1 | Diesel and petrol |
| Corporate buildings | 2 | Electricity generation |
| Corporate buildings | 3 | Electricity T and D losses |
| Grey fleet (staff mileage) | 3 | Fuel miles |
| Outsourced Leisure Centres | 3 | Electricity and natural gas |
| Landscape contractors | 3 | Electricity, diesel and petrol |
| Corporate buildings | Neutral and credit | Renewable generation - generation |
| Corporate buildings | Neutral and credit | Renewable generation - export |
In July 2019 the council committed to becoming carbon neutral by 2030 for all its reported emission sources, which include corporate and contractor emissions.
The carbon factor methodology applied are the 2020 advanced carbon factors for the emissions generated in the financial year 2020/21.
These can be found at Greenhouse gas reporting: conversion factors 2020 - Gov.uk
Greenhouse Gas (GHG Emissions) 2019/20
For 2020/21 our gross emissions were 3220 tonnes of CO2 equivalent (CO2e) split across the six service areas and fuel types. This includes offsetting from solar exports in corporate and leisure centre buildings (as highlighted in Table 1 in the changes from previous year section).
Figure 2 - Total GHG emissions breakdown per sector and fuel type (tonnes CO2e)
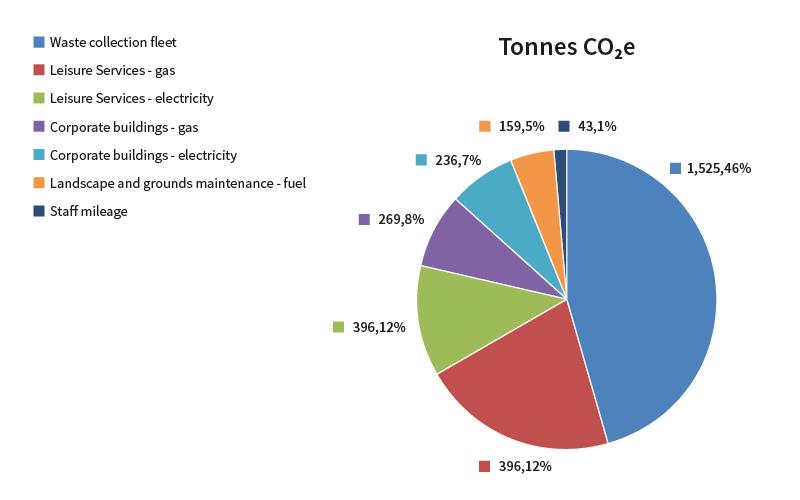
| Sector | Tonnes CO2e | Percentage |
|---|---|---|
| Waste collection fleet | 1,525 | 45.8 |
| Leisure Services - gas | 705 | 21.2 |
| Leisure Services - electricity | 396 | 11.9 |
| Corporate buildings - gas | 269 | 8.1 |
| Corporate buildings - electricity | 236 | 7.1 |
| Landscape and grounds maintenance - fuel | 159 | 4.8 |
| Staff mileage | 43 | 1.3 |
Change from previous year
Total emissions in 2020/21 fell from 4,154 to 3220 tonnes of CO2e - a reduction of 22.5 per cent (934 tonnes of CO2e).
- CO2e emissions from corporate buildings, public conveniences, waste collection fleet and business mileage fell from 2229 tonnes to 1984 tonnes - a reduction of 2.3 per cent. This includes offsets from Solar PV exports.
- Emissions from outsourced leisure centres and outsourced landscape service fell from 2125 to 1236 tonnes of CO2e - a reduction of 41.8 per cent. This includes offsets from Solar PV exports.
Table 1: Emissions comparison 2018/19 and 2019/20 (tonnes CO2e)
| Emissions from | 2019/20 | 2020/21 | Reduction (per cent) |
|---|---|---|---|
| Corporate buildings | 622 | 495 | -20.3 |
| Public conveniences | 5 | 10 | 105.5 |
| Waste collection fleet | 1,349 | 1,525 | 13.1 |
| Staff mileage | 94 | 43 | -54.1 |
| Solar export corporate (offset) | -40 | -89 | |
| Total of these emissions | 2,029 | 1,984 | 2.2 |
| Leisure Services | 2,024 | 1,101 | -45.6 |
| Landscale and ground maintenance | 134 | 159 | 18.8 |
| Solar export Leisure Centre (offset) | -33 | 24 | |
| Total contractors emissions | 2,125 | 1,236 | -41.8 |
| Total all emissions | 4,154 | 3,220 | -22.5 |
Non-influenced decarbonisation (due to electricity grid decarbonisation and annual changes to carbon factors) accounted for 51 tonnes CO2e (5.5 per cent of total reduction), with influenced decarbonisation (due to changes in consumption) accounting for the remainder.
Impact of COVID-19 on ventilation: restrictions to working arrangements and subsequent guidance on ventilation has meant that realistic comparison with previous years is not appropriate at this stage.
Figure 3: CO2e reduction from grid decarbonisation against total reduction.
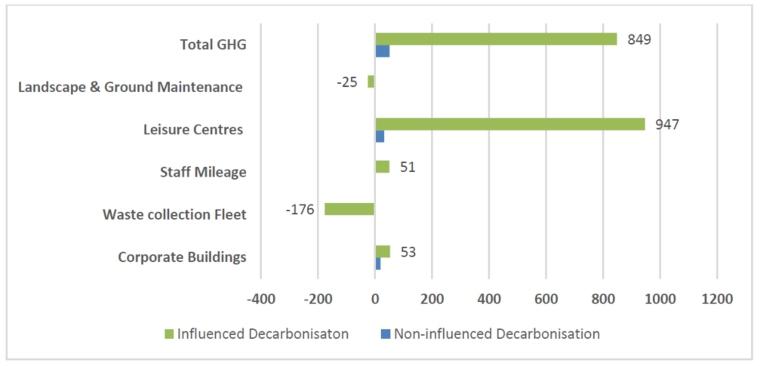
| Area | Non-influenced decarbonisation | Influenced decarbonisation | Total |
|---|---|---|---|
| Corporate Buildings | 19 | 53 | 72 |
| Waste collection Fleet | 0 | -176 | -176 |
| Staff Mileage | 0 | 51 | 51 |
| Leisure Centres | 32 | 947 | 979 |
| Landscape & Ground Maintenance | 0 | -25 | -25 |
| Total GHG | 51 | 849 | 900 |
Gas consumption in 2019/20 increased in line with expectations due to weather differences between 2018/19 and 2019/20. We will be investigating the option to install automatic meter readers to improve the accuracy of gas consumption data.
Comparison against baseline year and reduction target
We track emissions against the baseline year of 2008/09.
Total emissions were 6,804 tonnes of CO2e in 2008/09 and 3220 tonnes CO2e in 2020/21. This represents a decrease of 3584 tonnes of CO2e or 52.7 per cent since the baseline year, equivalent to an average reduction of 4.4 per cent per year.
- Emissions from corporate buildings, public conveniences, waste collection fleet and business mileage have reduced by 28.2 per cent since 2008/09, an average reduction of 2.3 per cent per year.
- Emissions from outsourced leisure centres and outsourced landscape service have reduced by 67.8 per cent since 2008/09, an average reduction of 5.7 per cent per year.
Table 2: Emissions Comparison 2008/09 and 2020/21 (tonnes CO2e)
| Emissions from | 2008/09 | 2020/21 | Reduction (per cent) |
|---|---|---|---|
| Corporate buildings | 1,278 | 495 | -61.2 |
| Public conveniences | 37 | 10 | -73.3 |
| Waste collection fleet | 1,419 | 1,525 | 7.5 |
| Staff mileage | 154 | 43 | -72.1 |
| Solar export corporate (offset) | -89 | ||
| Total of these emissions | 2,888 | 1,984 | -31.3 |
| Leisure Services | 3,748 | 1,101 | -70.6 |
| Landscale and ground maintenance | 168 | 159 | -5.7 |
| Solar export Leisure Centre (offset) | - | 24 | |
| Total contractors emissions | 3,916 | 1,236 | -68.4 |
| Total all emissions | 6,804 | 3,220 | -52.7 |
Figure 4 below shows carbon emissions from the baseline year 2008/09 to 2020/21 with a breakdown of consumption by sector and fuel type.

You can view a detailed breakdown of emissions from the baseline year 2008/09 to 2020/21 (ods format) with a breakdown of consumption by sector and fuel type.
Measurement, data quality, methodology and refinements
We collect the data from property invoices, staff millage claims and fleet travel records.
Annex A: Operational scope breakdown
- Central Offices (Scopes 1 and 2)
- Operational Depots (Scope 1 and 2)
- EV Fleet (Scope 2)
- Fleet (Scope 1)
- Business miles (including cycling)- corporate estate and activities (Scope 3)
- Transmission and Distribution (Scope 3)
- Vacant properties - (in Scope 3)
- Outsourced Leisure Centre’s (Scope3)
- Landscape Contractors (Scope 3)
Not included in current reporting and reasoning
We do not currently include the following in our reporting for a variety of reasons but will annually review this situation:
- Water (Scope 3) - currently no reliable data available
- Supply Chain (Scope 3) – no data available
- Staff Commuting to work (Scope 3) - no data available
- Business mileage from public transport and walking (Scope 3) - currently no data available.
Contact and further information
This report was compiled by the Climate Action Team. If you would like further information please email: climate.action@oxfordshire.gov.uk