Gender pay gap report 2025
Background
The Equality Act 2010 (Specific Duties and Public Authorities) Regulations 2017 stipulate that all businesses, public sector and third sector organisations with over 250 employees must publicly report on average pay differences between their male and female employees. The Regulations require employers to publish their:
- Mean gender pay gap in hourly pay
- Median gender pay gap in hourly pay
- Mean bonus gender pay gap
- Median bonus gender pay gap
- Proportion of males and females receiving a bonus payment, and
- Proportion of males and females in each pay quartile.
As a public sector body, we are required to publish this pay gap information within 12 months, taking the “snapshot date” of 31 March 2025.
Our calculations follow the legislative requirements as set out in the Equality Act 2010 (Specific Duties & Public Authorities) Regulations 2017. All staff who were deemed to be relevant employees at 31 March 2025 are included.
This information will be published on the Cherwell District Council (CDC) website for a minimum of 3 years and published on the government website by 31 March 2026.
Equal pay and gender pay gap
The purpose of gender pay gap reporting is to achieve greater gender equality in terms of pay across the UK and increase pay transparency. This differs from equal pay which deals with differences between men and women who carry out the same roles.
Details within this report
Using a snapshot of employees’ pay as at 31 March 2025, 4 of the 6 calculations detailed above were made:
- Mean gender pay gap
- Median gender pay gap
- Proportion of males and females receiving a bonus payment, and
- The proportion of men and women divided into four quartile pay bands
The remaining 2 calculations relate specifically to bonus payments. The only bonuses awarded by CDC are to celebrate long service and these would not therefore be included in an employees’ hourly rate for the reporting period. Details on long service awards provided by gender have been included in this report for information.
Information required for publication
Relevant employee
An employee who was on full pay at the point of the data snapshot as at 31 March 2025.
Mean gender pay gap
The mean is defined as the average of the figures and is calculated by adding up all the figures and dividing by the number there are.
Median gender pay gap
The median is defined as the salary that lies at the midpoint and is calculated by ordering all salaries from highest to lowest and the median is the central figure.
Quartile pay bands
The quartile information is calculated by listing all salaries from highest to lowest and then splitting that information into four equal quarters to determine the percentage of male/female employees in each quartile.
Workforce profile
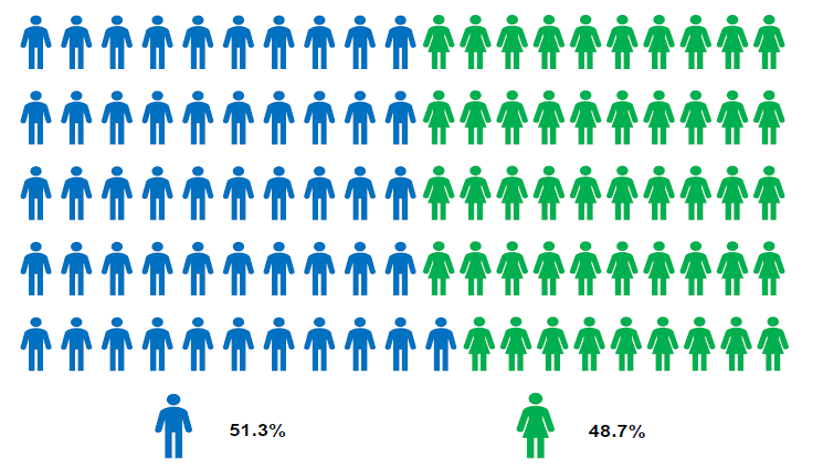
On 31 March 2025, CDC had 544 relevant employees; of which 51.3% (279 employees) were men and 48.7% (265 employees) were women.
Gender pay gap as at 31 March 2025
Mean: percentage difference and average hourly rate of pay

The mean difference recorded at CDC has decreased from the previous year and still remains substantially less than the national public sector mean pay gap which is 12.3% (Office for National Statistics).
| Data snapshot | Mean gender pay gap | Hourly pay rate |
|---|---|---|
| March 2025 | 3.1% | £0.65 pence per hour |
| March 2024 | 4.97% | £1.01 pence per hour |
| March 2023 | 2.49% | £0.47 pence per hour |
| March 2022 | 1.64% | £0.29 pence per hour |
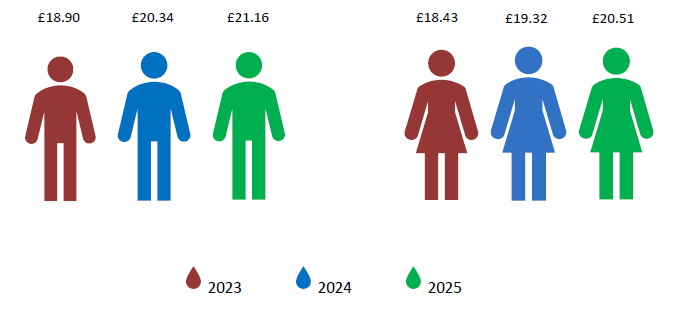
As at 31 March 2025 the mean hourly rate for men was £21.16 per hour and for women it was £20.51 per hour. This means that men earned an average of £0.65 per hour more than women, which equates to a mean difference of 3.1%.
Changes in mean hourly pay rates for both male and females over the previous three years can be seen in the diagram below.
Mean Male and Female Hourly Pay Rates:
- Male: 2023 £18.90; 2024 £20.34; 2025 £21.16.
- Female: 2023 £18.43; 2024 £19.32; 2025 £20.51
Median: percentage difference and hourly rate of pay: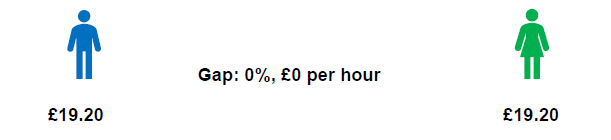
As at 31 March 2025 the median hourly rate of pay for men and women was the same with both being paid £19.20 per hour. This is the fourth time in a 4-year period that there has been no median difference between men and women. As there is no median difference as at 31 March 2025, CDC remain substantially less than the national public sector median pay gap which is 13.5% (Office for National Statistics).
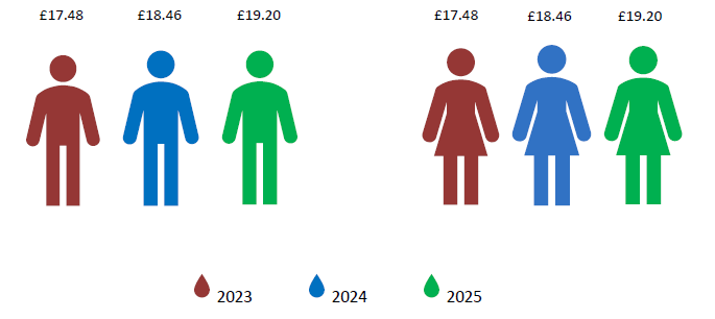
The figures for the previous three years can be seen in the diagram below. This diagram shows a consistent increase in hourly rate of pay for both men and women over the last three years.
Median Male and Female Hourly Pay Rates:
- Male: 2023 £17.48; 2024 £18.46; 2025 £19.20
- Female: 2023 £17.48; 2024 £18.46; 2025 £19.20
Proportion of men and women receiving bonuses
The only bonuses awarded at CDC are to celebrate long service awards. These awards are detailed below:
| Eligible service | Bonus awarded |
|---|---|
| 20 years | £100 gift voucher |
| 25 years | £200 gift voucher |
| 30 years | £300 gift voucher |
| 40 years | £500 gift voucher |
During the reporting period 19 long service bonuses were awarded, 10 to men and 9 to women.
The overall percentage of men receiving a bonus was 3.6%. The overall percentage of women receiving a bonus was 3.4%.
Pay quartiles
CDC employed 544 relevant employees as at 31 March 2025 which means there are 136 employees in all quartiles. The gender split per quartile as at 31 March 2025 is detailed below and serves as a useful benchmark to determine progression through the pay scales.
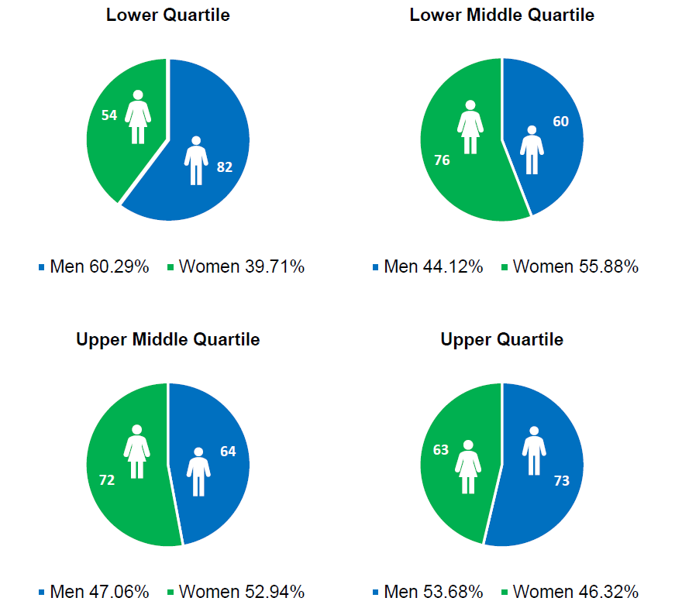
| Quartile | Men | Men (%) | Women | Women (%) |
|---|---|---|---|---|
| Lower | 82 | 60.29 | 54 | 39.71 |
| Lower Middle | 60 | 44.12 | 76 | 55.88 |
| Upper Middle | 64 | 47.06 | 72 | 52.94 |
| Upper | 73 | 53.68 | 63 | 46.32 |
The hourly rates that represent each quartile are as follows:
- Upper - relates to the hourly rates of £23.16 and above
- Upper middle - relates to the hourly rates of £19.20 - £23.08
- Lower middle - relates to the hourly rates of £15.81 - £19.20
- Lower - relates to the hourly rates up to £15.56
The percentage difference from 2024 to 2025 is displayed in the table below
|
Quartile |
% Men 2024 |
% Men 2025 |
% Women 2024 |
% Women 2025 |
% increase in gender |
|---|---|---|---|---|---|
| Lower | 54.07 | 60.29 | 45.93 | 39.71 | 6.22 in men |
| Lower middle | 48.51 | 44.12 | 51.49 | 55.88 | 4.39 in women |
| Upper middle | 49.25 | 47.06 | 50.75 | 52.94 | 2.19 in women |
| Upper | 53.73 | 53.68 | 46.27 | 46.32 | 0.05 in women |
When reviewing the quartiles year on year, they have remained fairly consistent. Three quartiles have seen increases in women being employed in those quartiles, with only the lower quartile seeing a 6.22% increase in men.
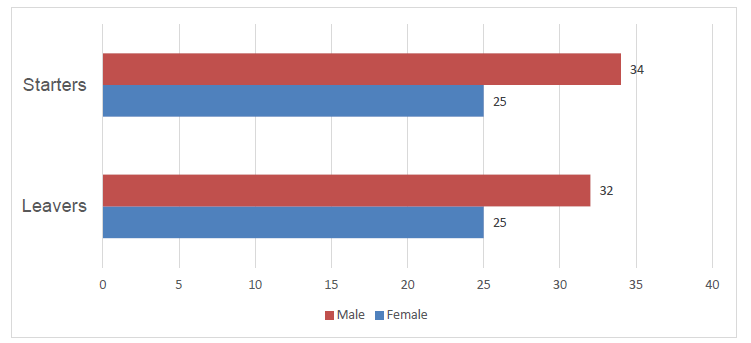
General turnover accounts for the majority of the change in quartiles. 7 additional employees were included in this year’s gender pay gap. Graph 1 outlines starters and leavers by gender for the financial year 2024/25
Graph 1 – Starters and Leavers by Gender during 2024/25.
CDC continues to do its utmost to ensure equity of opportunity when recruiting, for all with protected characteristics under the Equalities Act 2010, it is important that the process is robust and ultimately the person who demonstrates the best skills and attributes for the role is appointed. All applicants are measured against objective criteria, both at shortlisting and interview stage. This means that recruitment should be based on evidence-based merit and not be influenced by the protected characteristics of the applicant.
Commitment
We are committed to the principles of equality, diversity, fairness and inclusion and our approach to people management should not put any group at a disadvantage. Regardless of identity or background, everyone deserves to be able to develop their skills and talents to meet their full potential, work in a safe, supportive and inclusive environment, be fairly rewarded and recognised for the work they do and have the opportunity to have their say on matters that affect them. We are also committed to achieving a diverse workforce that fully reflects our community.
We will continue to advance our inclusion initiatives, particularly where there are any barriers for women to progress into higher paid roles.
Flexible and agile working and family friendly policies will assist Cherwell District Council to attract and retain staff in a competitive job market and in a geographical area with low unemployment.
Summary
This year sees a further increase in the gender pay gap at CDC with men now earning a mean difference of 3.1% more than women.
The median difference however reports no difference for the fourth time in a 4-year period.
Even with the shift in the mean, the gender pay gap at CDC does not pose a significant concern at this time and remains significantly lower than the public sector averages.
It will be necessary to continue to monitor and be committed to learning from best practice as part of our journey. The gender pay gap data will be analysed on an annual basis and a comparison of figures will be completed year on year. We will ensure that job grades continue to be determined through objective analysis and job evaluation to maintain the integrity of the pay and grading system.