Current Housing Register
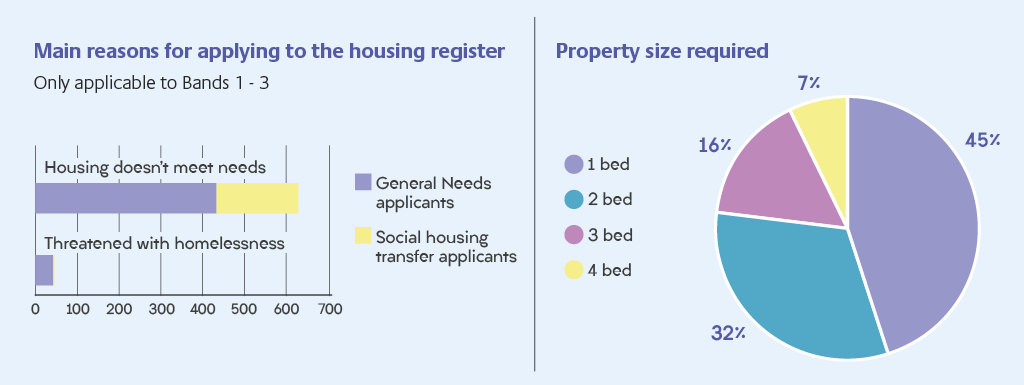
Main reasons for applying to the housing register
The housing register is made up of 1,449 households. This is an increase from the 1,306 recorded in April 2020, an overall increase of 11 per cent. Snapshot of the housing register on 1 April 2021:
- 404 of general needs applicants said housing doesn't meet their needs whilst 26 were threatened with homelessness.
- 208 social housing transfer applicants said housing doesn't meet their needs whilst 8 were threatened with homelessness.
Property size required
45 percent (668) of applicants applied for a 1 bed, 32 per cent (466) for a 2 bed, 16 per cent (233) for a 3 bed and 7 per cent (111) for a 4 bed property.
Average waiting times in weeks (by band)
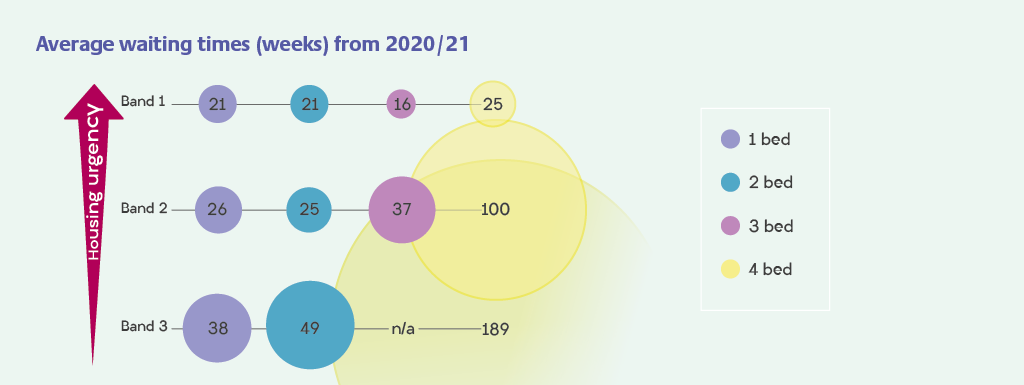
Although applicants in Band 1 have a higher level of housing need they may also have more complex circumstances or specific property requirements which could limit their housing options. In some cases, this may result in the household waiting longer to be allocated a suitable property than households in lower bands.
- Band 1 (most urgent): 1 bed - 21 weeks; 2 bed - 21 weeks; 3 bed 16 weeks; 4 bed - 25 weeks
- Band 2: 1 bed - 26 weeks; 2 bed - 25 weeks; 3 bed 37 weeks; 4 bed - 100 weeks
- Band 3: 1 bed - 38 weeks; 2 bed - 49 weeks; 3 bed n/a; 4 bed - 189 weeks
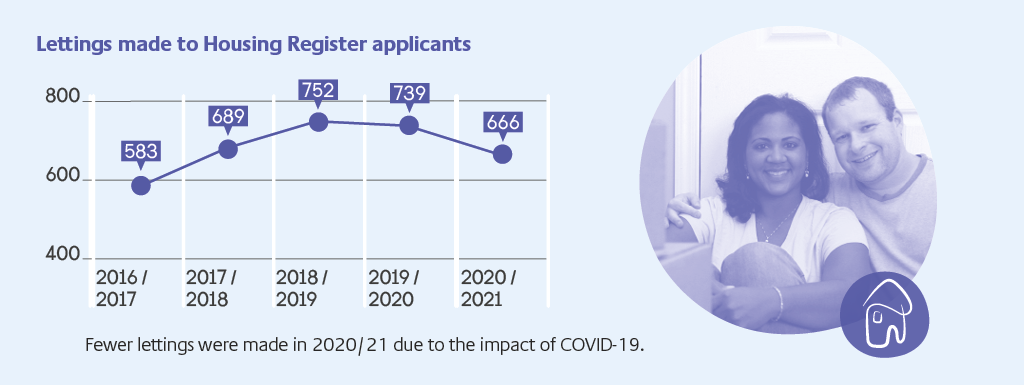
Lettings made to Housing Register applicants
666 lettings were made in 2021-2021 which is down on the 739 made in 2019-2020. This is due to the impact of COVID-19.
Properties let by area
Together, Banbury and Bicester amount to just under three quarters of all units let. This is mainly due to the number of existing units being re-let added to the high number of new social housing units being built in those areas.
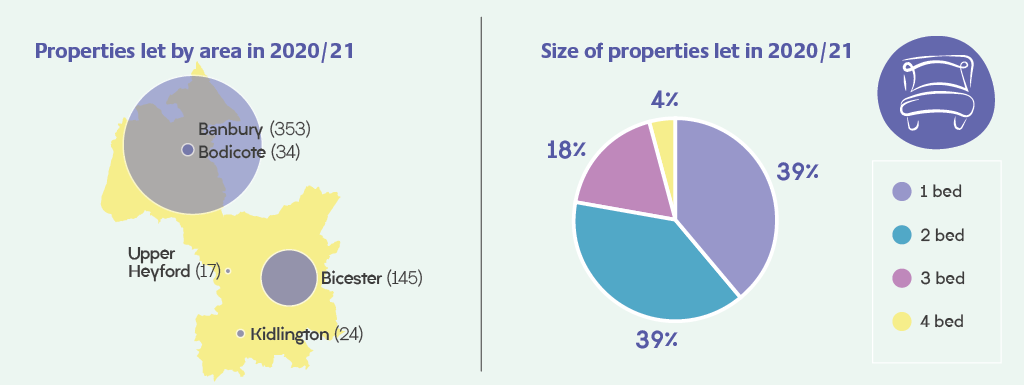
Properties let: Banbury 353; Bicester 145; Bodicote 34; Kidlington 24; and Upper Heyford 17
Age and sex of main applicants housed in 2020-21
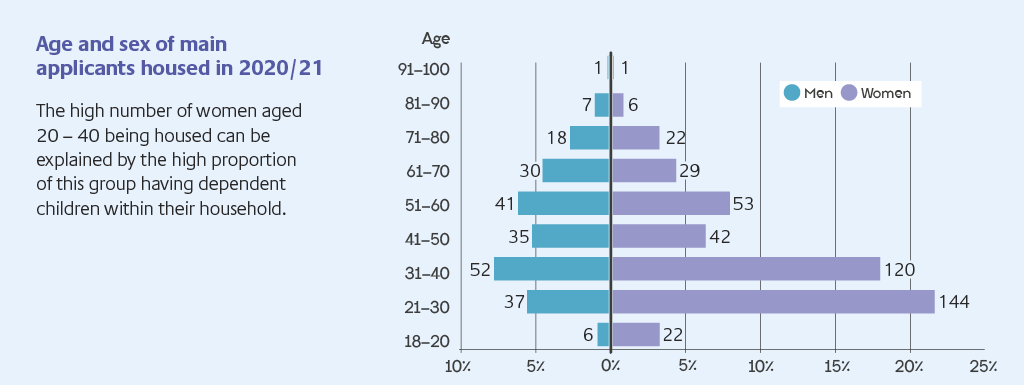
The high number of women aged 20 to 40 being housed can be explained by the high proportion of this group having dependent children within their household.
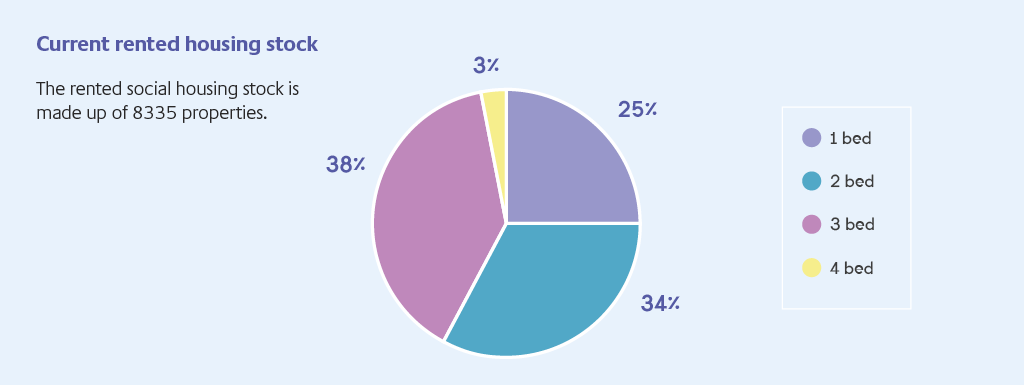
Current rented housing stock
The rented social housing stock is made up of 8,335 properties.
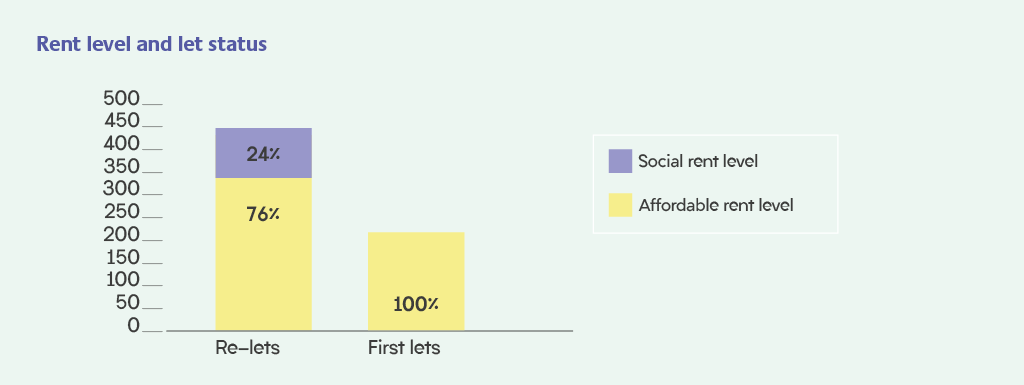
Rent level and let status
- Affordable lets: 100 per cent of first lets and 75 per cent of re-lets
- Social rent level: 24 per cent of re-lets
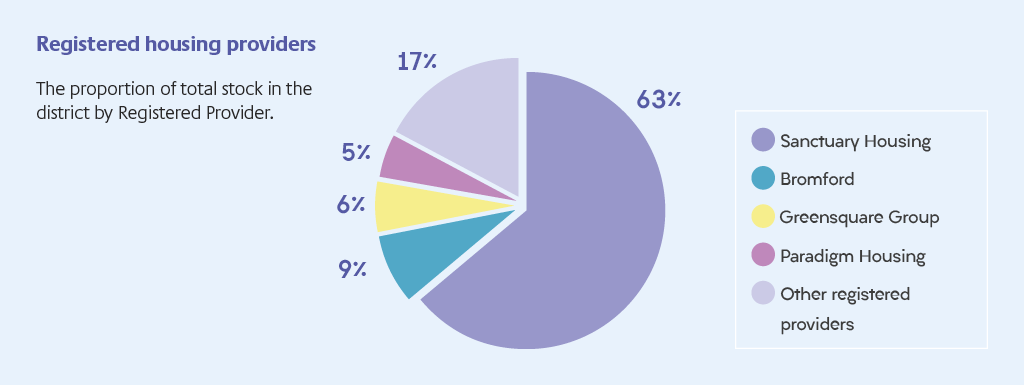
Registered housing providers
New social housing development
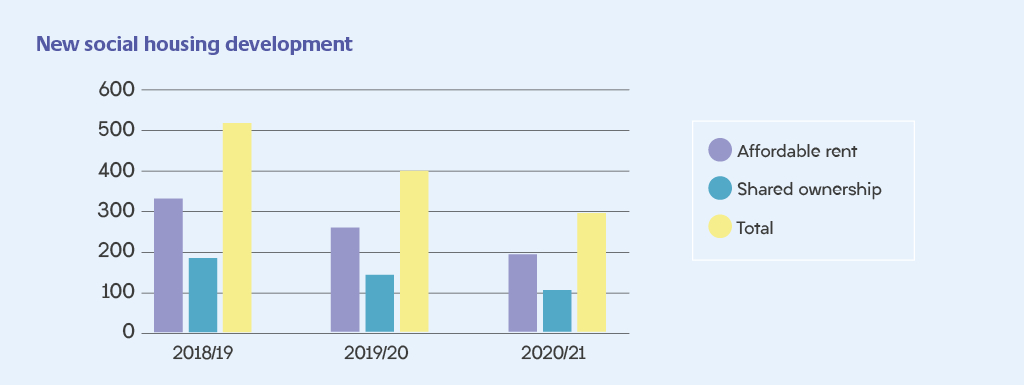
Comparison of development types over the last three year:
- 2020-21: Of the 295 developments, 192 were affordable rents and 103 shared ownership.
- 2019-20: Of the 400 developments, 259 were affordable rents and 141 shared ownership.
- 2018-19: Of the 510 developments, 335 were affordable rents and 175 shared ownership.
Cherwell affordability ratio
The average house price (£300,00) is 9.3 times more than the gross average salary ( £32,259) in Cherwell.
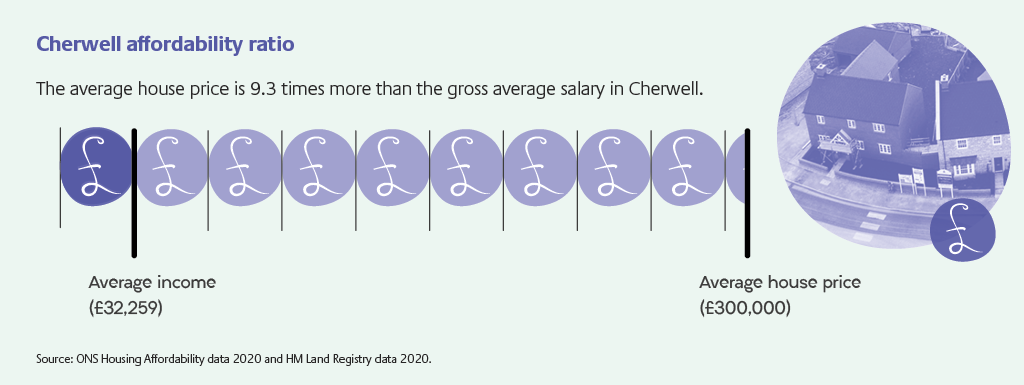
Source: ONS Housing Affordability data 2020 and HM Land Registry data 2020.
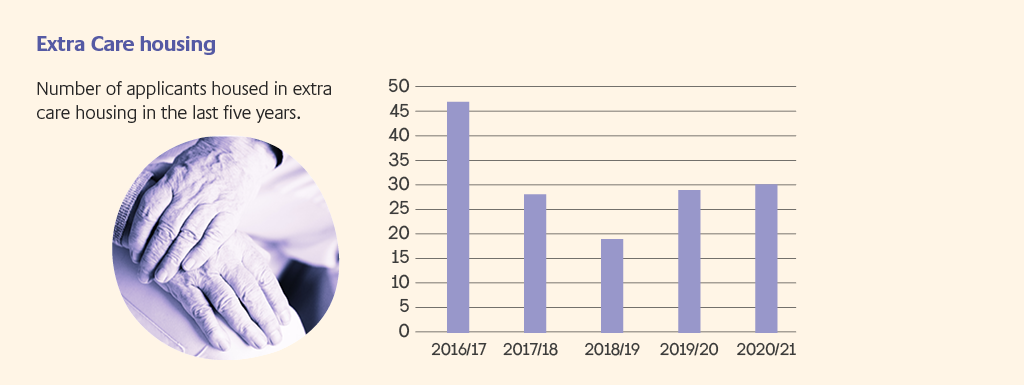
Extra Care housing
Comparison of number of applicants housed in extra care housing in the last five years:
- 2020-21 30 applicants; 2019-20 28 applicants; 2018-19 18 applicants; 2017-18 27 applicants and 2016-17 46 applicants.
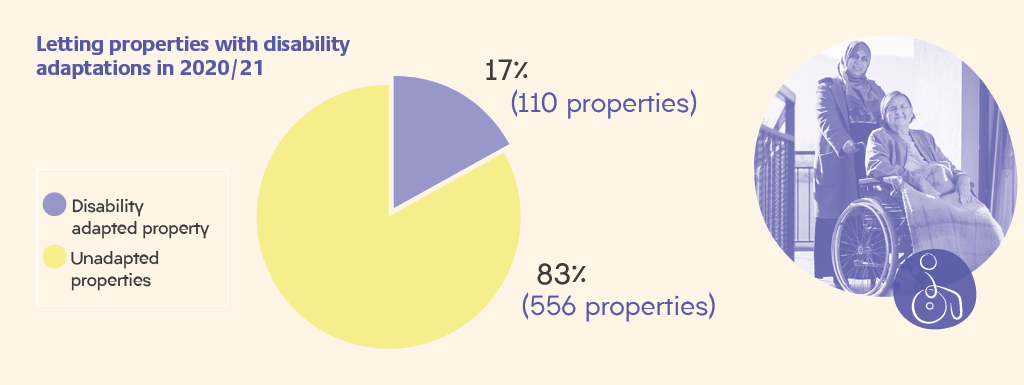
Letting properties with disability adaptations
Of 666 letting properties, 110 properties (17 per cent) made disability adaptations during 2021-2021